Energy Input into US Electricity Production From Nuclear, Petroleum, Natural Gas (1954-2007)

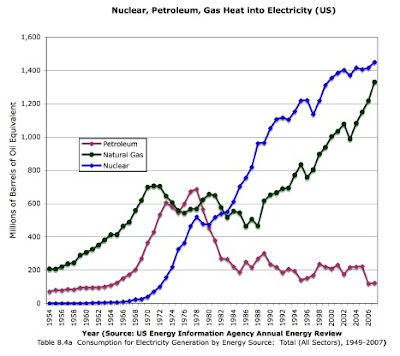
On Sunday July 13, I published a chart that illustrated the amount of heat energy input from oil and nuclear power that was converted into US consumed electricity in the years from 1954 (right after Eisenhower announced the Atoms for Peace program and Congress passed the Atomic Energy Act of 1954, which broke the US government’s legal monopoly on most nuclear knowledge and all nuclear fuel materials.)
My theory, based on the numbers provided by the energy statisticians is that nuclear fission heat pushed oil heat out of the electrical power market. Based on my experiences as a businessman, I have asserted that the vendors that were losing this market share did not particularly enjoy the experience and that it would be logical to assume that they did not give up their sales without a fight.
The chart and the associated post have generated quite a few interesting comments, including several requests to produce a modified graph that included natural gas heat used for electricity production.
I think that some who have been around the business for a few years may be a bit surprised by the shape of the resulting curves. Here is the team homework assignment – help me to provide some of the historical context that might help explain some interesting features in the curves.
I’ll start the ball rolling by noting that there were serious natural gas shortages during the 1970s, some of which resulted in customers in states like Michigan being “curtailed”. At the same time, other states had an abundance of natural gas selling at a higher price than the legal price in Michigan. In 1978, Congress passed a new law titled the Natural Gas Policy Act of 1978 that contained some interesting provisions.
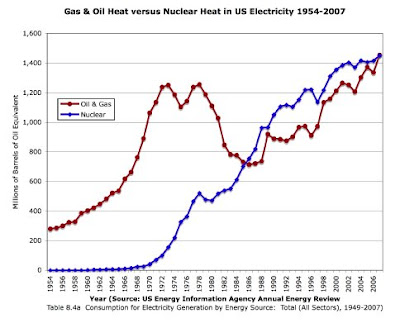
Update After doing a little thinking, I thought it would be interesting to show the combination of oil and gas versus nuclear since oil and gas are often found in the same wells and marketed by the same companies. The resulting curve is very interesting, especially if viewed over short periods of time and noting that whenever there is a temporary dip in nuclear heat sales to the electrical market, there is a corresponding rise in sales from oil and gas to electricity suppliers.
On a completely random note – notice that the number for 2007 for Oil + Gas combustion heat = Nuclear fission heat Hmmm.

Update: Posted on July 17, 2008. I thought it might be interesting to see how nuclear compares to oil+gas when put into the context of total electrical power fuel consumption. I started the graph in 1970, since that is when nuclear power began taking market share and when the anti-nuclear movement shifted from fighting nuclear weapons to fighting nuclear power plants.


