Strange numbers from a normally credible source
Matthew Simmons is an investment banker who has long been associated with the idea that the era of cheap oil is coming to an end. His analysis is based on the work of M. Hubbert King and other oil exploration experts who have recognized the idea that the world has a finite quantity of oil available and that we are nearing the point where we have consumed about half of the amount that we will ever be able to consume. The shorthand for that concept is called “Peak Oil”.
The reason for this post is to express some disappointment in the quality of Mr. Simmons’s research – at least as indicated by a single table included in a recent talk that he gave to Peabody Coal titled “Sunrise in Coal Fields: Coal’s Role in a Peak Oil World.” You can find a link to a PDF version of the talk at http://www.simmonsco-intl.com/research.aspx?Type=msspeeches
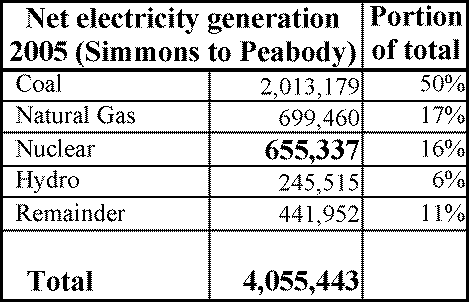
Page 11 of the talk is titled “Backing Out Natural Gas Kilowatt’s Creates Enormous Coal Use Growth”. The slide has a table titled “2005 Electricity Net Generation(Million KW Hours)”. Here are the numbers from that table:

I found the table strange because I am a numbers geek and I happen to know the Energy Information Agency figures for electricity production figures for recent years in the US reasonably accurately. The table did not jive with my remembered figures so I went to the source and looked them up.
In case you have never visited the site – I highly recommend the US Energy Information Agency’s web site as a source for historical energy information. (I normally discount that group’s ability to predict anything but the very near term, but they are pretty competent statistics gatherers.)
The applicable table in this case is titled “Net Generation by Energy Source by Type of Producer” and it is posted at:
http://www.eia.doe.gov/cneaf/electricity/epa/epat1p1.html
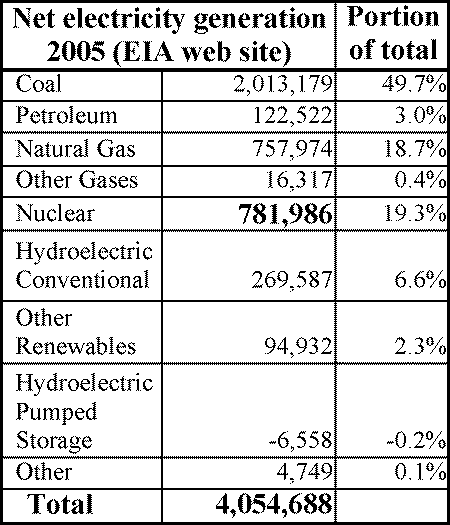
It is a lengthy table with data going back a number of years, but I have extracted the 2005 numbers for you.

Notice the difference? I have asked the point of contact listed on Mr. Simmons’s presentation if he can clarify why the coal and total electricity generation numbers are nearly exactly right, but that the rest of the numbers in the table are off by quite a large fraction.
Wonder if I’ll get a response. Any speculation on the reasons for this apparent lack of fact checking attention to detail?
